


By Jason Farley, COO, Leaders Moving & Storage Co.
Across the four Midwest metros served by Leaders Moving & Storage Co., households are moving away from the city center and toward the outer suburbs. To map Midwest moving trends, Leaders analyzed 22,598 home-to-home moves recorded in its MovePoint system from October 2021 through October 2026. In Columbus, Cleveland, Cincinnati and Indianapolis alike, the urban core sent out more households than it took in, and a short list of outer suburbs collected the difference.
What stands out is how short most of those moves are. People leaving the Short North tend to land Downtown or in Grandview. People leaving Dublin head to Plain City. People leaving Carmel head to Westfield. Most households move one step outward, usually to the next neighborhood or town over.
Midwest moving trends at a glance
- Plain City is the biggest magnet in the study. Nearly three households moved in for every one that left (402 in, 146 out), and the pace picked up over the last 30 months.
- Westfield, Indiana, gained about two households for every one it lost. Close to a third of its newcomers came from Carmel.
- Cleveland’s growth is heading west along the lake. North Ridgeville, Avon Lake and Avon posted the region’s largest gains, while Ohio City/Tremont and Lakewood posted the largest losses.
- Cincinnati’s gains are spread thin across Clermont and Warren counties. Hyde Park/Mount Lookout and Oakley lost the most households. The largest gain in any single suburb was 18 households, in Union Township.
- More households left the four core cities than moved in. For every 100 households that moved out of a Columbus, Cleveland, Cincinnati or Indianapolis address, between 77 and 83 moved in.
Columbus: the northwest corridor is pulling families out of Dublin
Plain City gained more households than any other ZIP in the study, a net gain of 256. Delaware (+175), Powell (+143), Sunbury (+108) and Galena (+85) round out the top five, all Columbus suburbs north or northwest of the city. The biggest losses were in the University District and Short North (43201), Northwest Columbus (43235), Westerville (43081), Downtown (43215) and Grandview Heights (43212).
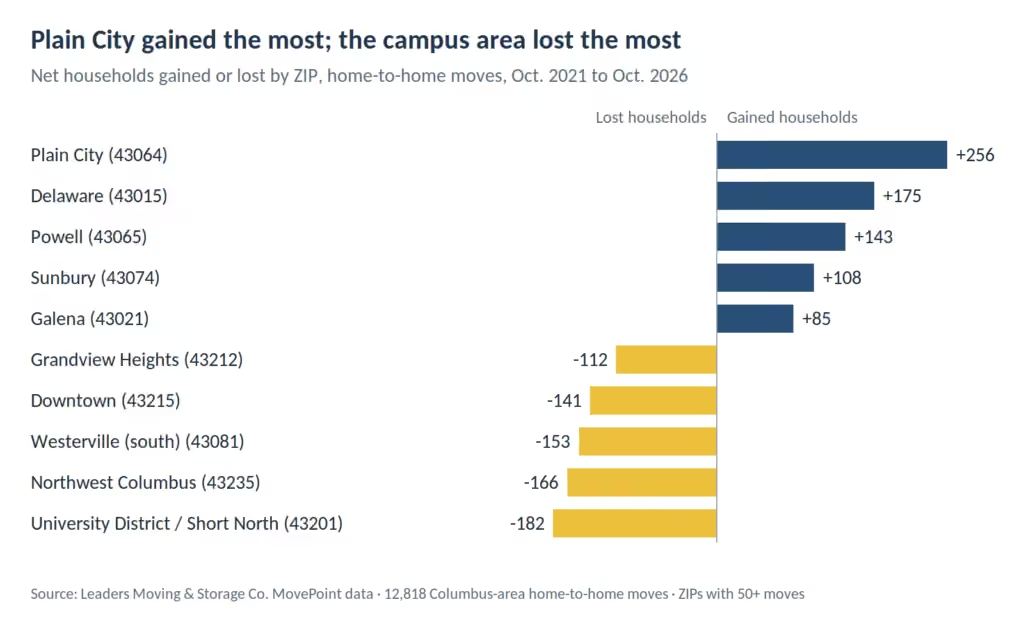
Columbus is the deepest part of the study, with 12,818 home-to-home moves, so its patterns are the clearest.
Where people are coming from and going
About 35% of households moving into Plain City came from Dublin’s two ZIPs, and another 11% came from Hilliard. Nine in ten of them moved into a house. People who move to Plain City also tend to stay. Of the moves that started in Plain City, 44% ended there too, the highest rate of any Columbus-area ZIP.
Delaware draws heavily from its neighbors to the south, with Lewis Center and Powell together supplying 28% of its newcomers. Households leaving southern Westerville (43081) most often landed in northern Westerville (43082), New Albany, Delaware, Lewis Center and Galena.
What changed over five years
Comparing the first 30 months of the data with the most recent 30 months:
- Plain City sped up, from a net gain of 109 to 147.
- Powell and Marysville cooled. Powell’s gain fell from 91 to 52, and Marysville’s from 45 to 14.
- German Village nearly broke even. Its deficit shrank from 66 to 8. When people do leave German Village, Bexley is their most common next stop.
- The University District and Short North deficit nearly doubled, from 67 to 115. Some of that is the natural churn of a campus neighborhood, and most people leaving don’t go far: Downtown, Grandview, Upper Arlington and German Village were the top destinations.
- Dublin’s 43016 ZIP slipped, from a deficit of 15 to 61.
First homes and downsizing
Nearly 1,500 Columbus-area moves went from an apartment to a house. Southern Westerville, Powell, Delaware, Hilliard, Upper Arlington and Plain City were the most common places to land that first house.
Westerville also tops the list for the opposite move. Southern Westerville, Powell and Dublin were the leading destinations for households going from a house to a condo or apartment, followed by Downtown. Westerville runs a net deficit overall, yet it’s the top landing spot for both first-time house movers and downsizers.
Cleveland: the west side keeps moving west
Among Cleveland suburbs, North Ridgeville posted the largest net gain (+47), followed by Avon Lake (+39), Avon (+29), Brunswick (+21) and Independence (+20). Avon Lake drew nearly two households for every one it lost. The largest losses were in Ohio City and Tremont (44113), Lakewood, University Circle and Little Italy (44106), Detroit-Shoreway and Gordon Square (44102) and Parma (44134).
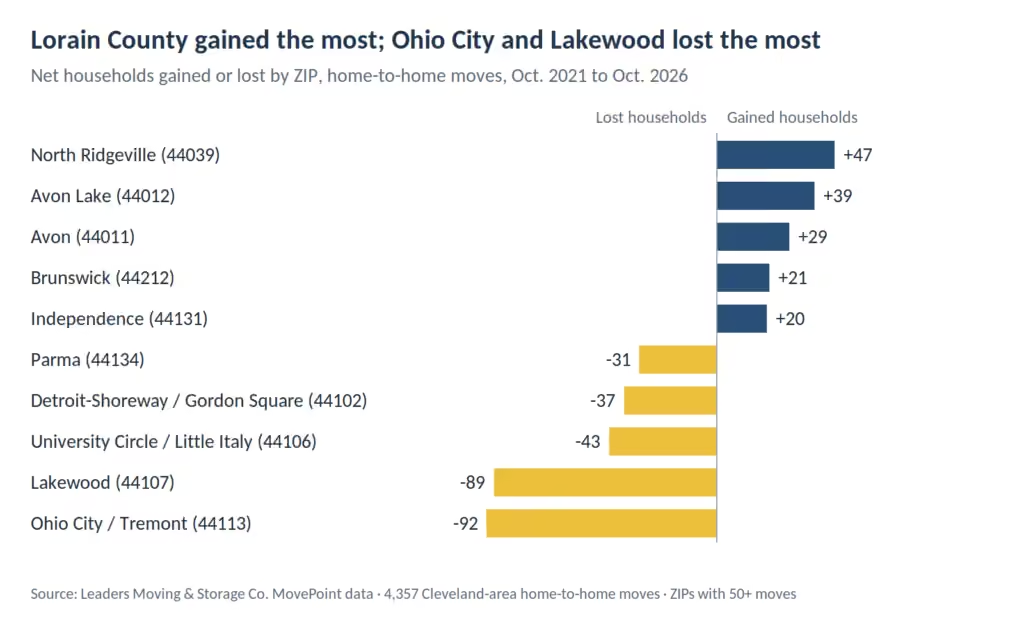
The Cleveland data covers 4,357 home-to-home moves.
Where people are coming from and going
In Cleveland, the moves run west along the lakeshore. Households leaving Ohio City and Tremont most often moved to Lakewood or Detroit-Shoreway. Households leaving Lakewood most often moved to Westlake, Rocky River, West Park, Avon and Bay Village. Avon Lake’s newcomers came mostly from Westlake, Rocky River, North Olmsted and Lakewood.
What changed over five years
Comparing the first 30 months of the data with the most recent 30 months:
- Avon and Avon Lake picked up speed. Avon’s net gain grew from 5 to 24, and Avon Lake’s from 12 to 27.
- North Ridgeville cooled but stayed on top, going from a net gain of 29 to 18.
- Lakewood stabilized. Its deficit shrank from 71 to 18.
- The near-downtown neighborhoods lost more. Ohio City and Tremont went from a deficit of 33 to 59, and University Circle and Little Italy from 8 to 35.
The Lakewood paradox
Lakewood lost more households than it gained, yet it was the single most common destination in the Cleveland market for two very different moves. It led for households moving from an apartment into a house, and it led for households moving from a house into a condo or apartment. People move there when they leave an apartment for a house, and again when they leave a house for something smaller.
Cincinnati: Hyde Park and Oakley lose ground as Clermont and Warren counties gain
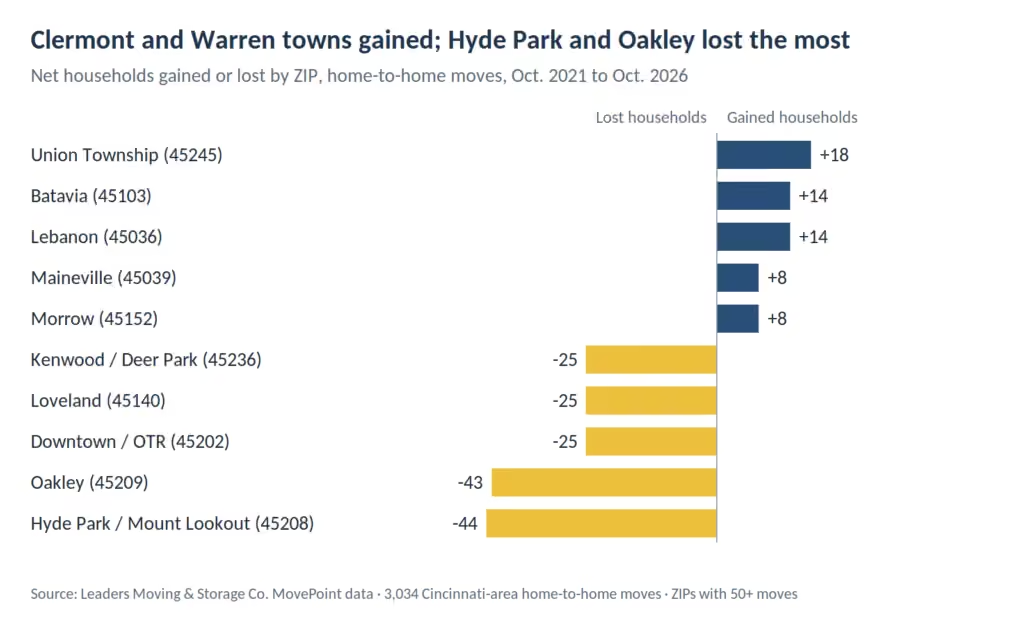
Hyde Park and Mount Lookout (45208) and Oakley (45209) lost more households than anywhere else in Greater Cincinnati. Oakley took in fewer than half as many households as it sent out (37 in, 80 out). Downtown and Over-the-Rhine (45202), Loveland, and Kenwood and Deer Park (45236) followed.
The gains are spread across smaller Cincinnati suburbs to the east and north: Union Township in Clermont County (45245, +18), Batavia (+14), Lebanon (+14), Maineville (+8) and Morrow (+8). Cincinnati’s data covers 3,034 home-to-home moves, so read these as direction rather than a precise ranking.
Where people are coming from and going
The pattern is clearest on the east side. Households moving into Union Township came most often from Anderson Township, Batavia and Amelia. Across the river, the trade with Northern Kentucky ran almost exactly even, with Covington (35 in, 34 out) and Newport (33 in, 30 out) close to balanced.
What changed over five years
Comparing the first 30 months of the data with the most recent 30 months:
- Mason turned around, from a net loss of 19 households to a net gain of 10.
- Loveland stopped losing, going from a deficit of 26 to a gain of 1.
- Batavia reversed, from a net gain of 21 to a loss of 7.
- Hyde Park and Mount Lookout lost a little more, with the deficit growing from 19 to 25.
First homes and downsizing
Mason was the most common place to move from an apartment into a house, followed by Kenwood and Deer Park. For households going from a house to a condo or apartment, Blue Ash and Montgomery (45242), Mason and Downtown led the list.
Indianapolis: Westfield is catching Carmel's overflow
Westfield gained 67 more households than it lost, more than three times any other Indianapolis suburb. It drew about two households for every one that left (131 in, 64 out). Zionsville (+19), McCordsville (+18), Whitestown (+13) and Fortville (+12) complete the top five. The largest losses were in the Broad Ripple area (46220), Irvington and Warren Township (46219), Oaklandon and the Geist area (46236), Fishers (46037) and Downtown (46204).
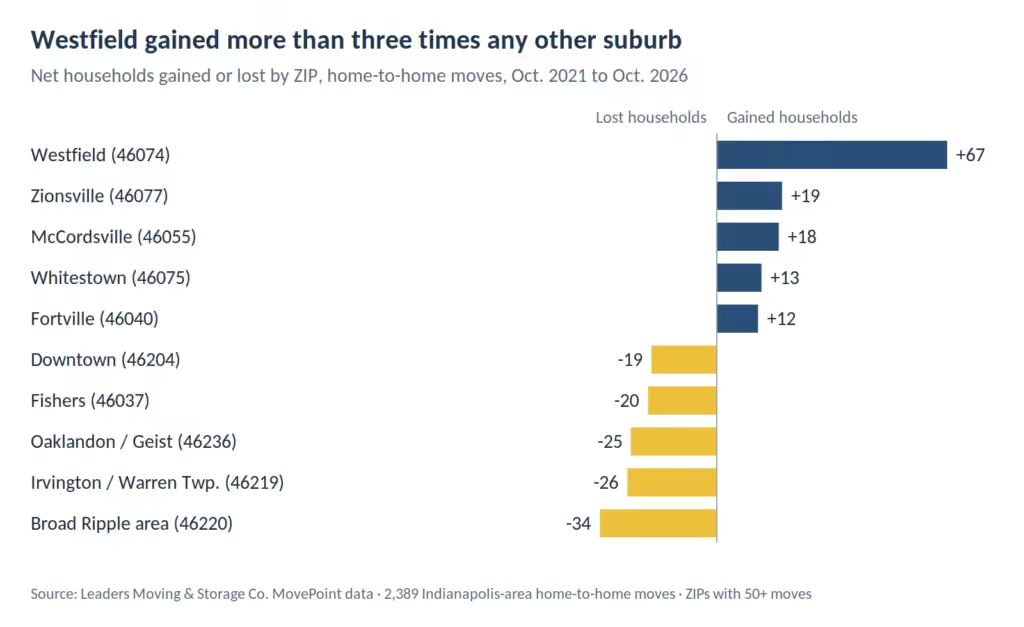
The Indianapolis data covers 2,389 home-to-home moves.
Where people are coming from and going
About 31% of the households moving into Westfield came from Carmel’s two ZIPs, and Noblesville was the next most common source. Carmel itself came out close to even (216 in, 222 out). It sends households north to Westfield while drawing households who are scaling down.
What changed over five years
Comparing the first 30 months of the data with the most recent 30 months:
- Zionsville took off, going from a net gain of 4 to 15.
- McCordsville doubled its gain, from 6 to 12.
- Westfield kept climbing, from a net gain of 31 to 36.
- West Carmel (46032) slipped, from a gain of 3 to a loss of 11.
First homes and downsizing
Westfield was the most common place in the Indianapolis market to move from an apartment into a house, followed by east Carmel (46033). West Carmel (46032) was the clear leader for households going from a house to a condo or apartment, with more than twice as many as the next ZIP.
Between the metros: Ohio's three C's trade almost evenly
Of the 557 home-to-home moves between two of the four metros, nearly nine in ten started or ended in Columbus. The trades with Cleveland and Cincinnati ran close to even in both directions.
| Route | Moves one way | Moves the other way |
|---|---|---|
| Columbus and Cleveland/Akron | 125 to Cleveland/Akron | 110 to Columbus |
| Columbus and Cincinnati | 104 to Cincinnati | 92 to Columbus |
| Columbus and Indianapolis | 35 to Indianapolis | 16 to Columbus |
| Cincinnati and Indianapolis | 20 to Indianapolis | 12 to Cincinnati |
| Cincinnati and Cleveland/Akron | 14 to Cleveland/Akron | 17 to Cincinnati |
| Cleveland/Akron and Indianapolis | 9 to Indianapolis | 3 to Cleveland/Akron |
Columbus is also Leaders’ largest market, which is part of why it shows up on so many of these routes. For moves leaving the region, Chicago and Pittsburgh were the most common out-of-state destination cities.
What this means if you're planning a move
Most moves in this study were short hops to the next neighborhood or suburb over. Short doesn’t mean simple, though. Whether you’re going three miles across town or two exits up the interstate, a move still means packing a whole life into boxes and getting it there on a deadline.
A few things to keep in mind, depending on the kind of move you’re making:
- Moving from an apartment into your first house? Lease end dates and closing dates rarely line up perfectly. Short-term, climate-controlled storage can bridge the gap so you aren’t paying for two places or rushing either move.
- Heading to a newer outer suburb? If you’re buying new construction, build schedules can shift. Ask about combining your move with storage so a delayed closing doesn’t derail moving day.
- Downsizing to a condo or apartment? Start early, sort room by room, and decide what goes with you, what goes to family and what goes to donation or junk removal. Keepsakes deserve extra care in packing.
- Moving between metros? A Columbus-to-Cleveland or Cincinnati-to-Columbus move needs more coordination than a cross-town move. A dedicated move coordinator can keep the timeline, crew and truck on track.
Whatever your next move looks like, Leaders Moving & Storage Co. has been helping Midwest families and businesses move since 1994, with more than 180,000 moves completed across Cincinnati, Cleveland, Columbus and Indianapolis. Leaders’ full-time, professionally trained crews handle moving, packing and storage under one roof, and your price is exact and guaranteed once a move coordinator reviews your inventory. No hourly guessing games, and no surprise charges on moving day.
Ready to plan your move? Request a free quote or call your local Leaders team to talk with a move coordinator.
Jason Farley has been with Leaders Moving & Storage since 1997, working his way from the moving crew to Chief Operating Officer. He oversees the company’s operations, fleet, safety, and financial management from Columbus.
METHODOLOGY
This study uses 27,631 move records from the MovePoint system at Leaders’ Cincinnati, Cleveland, Columbus and Indianapolis branches, with move dates from October 12, 2021, through October 10, 2026.
- Moves included: The analysis covers the 22,598 moves where both the starting and ending address was a house, apartment or condo. Moves into or out of storage, offices and commercial warehouses were left out.
- Locations: Each move is placed by the ZIP code and city on its origin and destination addresses. Neighborhood names are general descriptions of each ZIP, which can cover more than one neighborhood.
- Net gain or loss: Moves into a ZIP minus moves out of it, counted within each Leaders market. Rankings include only ZIPs with at least 50 moves in and out combined.
- Core cities: Core-city figures use the city name on the address. Mailing city names can extend beyond city limits.
- Change over time: Two equal 30-month windows: October 12, 2021, to April 10, 2024, and April 11, 2024, to October 10, 2026.
- Housing type: Based on the building type recorded for each address. “Apartment to house” moves are a stand-in for renters buying a home, not a confirmed change in ownership.
- Who’s counted: The data reflects households that moved with Leaders, not every household in each metro. It shows the direction of moves among full-service moving customers rather than census-level population change.
